Burnup Chart
Author

Sohrab Salimi
Reading time
1 Minutes
Definition of Burnup Chart:
A burnup chart tracks how much work has been completed. There are two lines on the chart—one line represents total work and the other represents work completed. The vertical axis represents the amount of work and can be measured in number of tasks, hours, or story points. The horizontal axis represents time, usually measured in days.
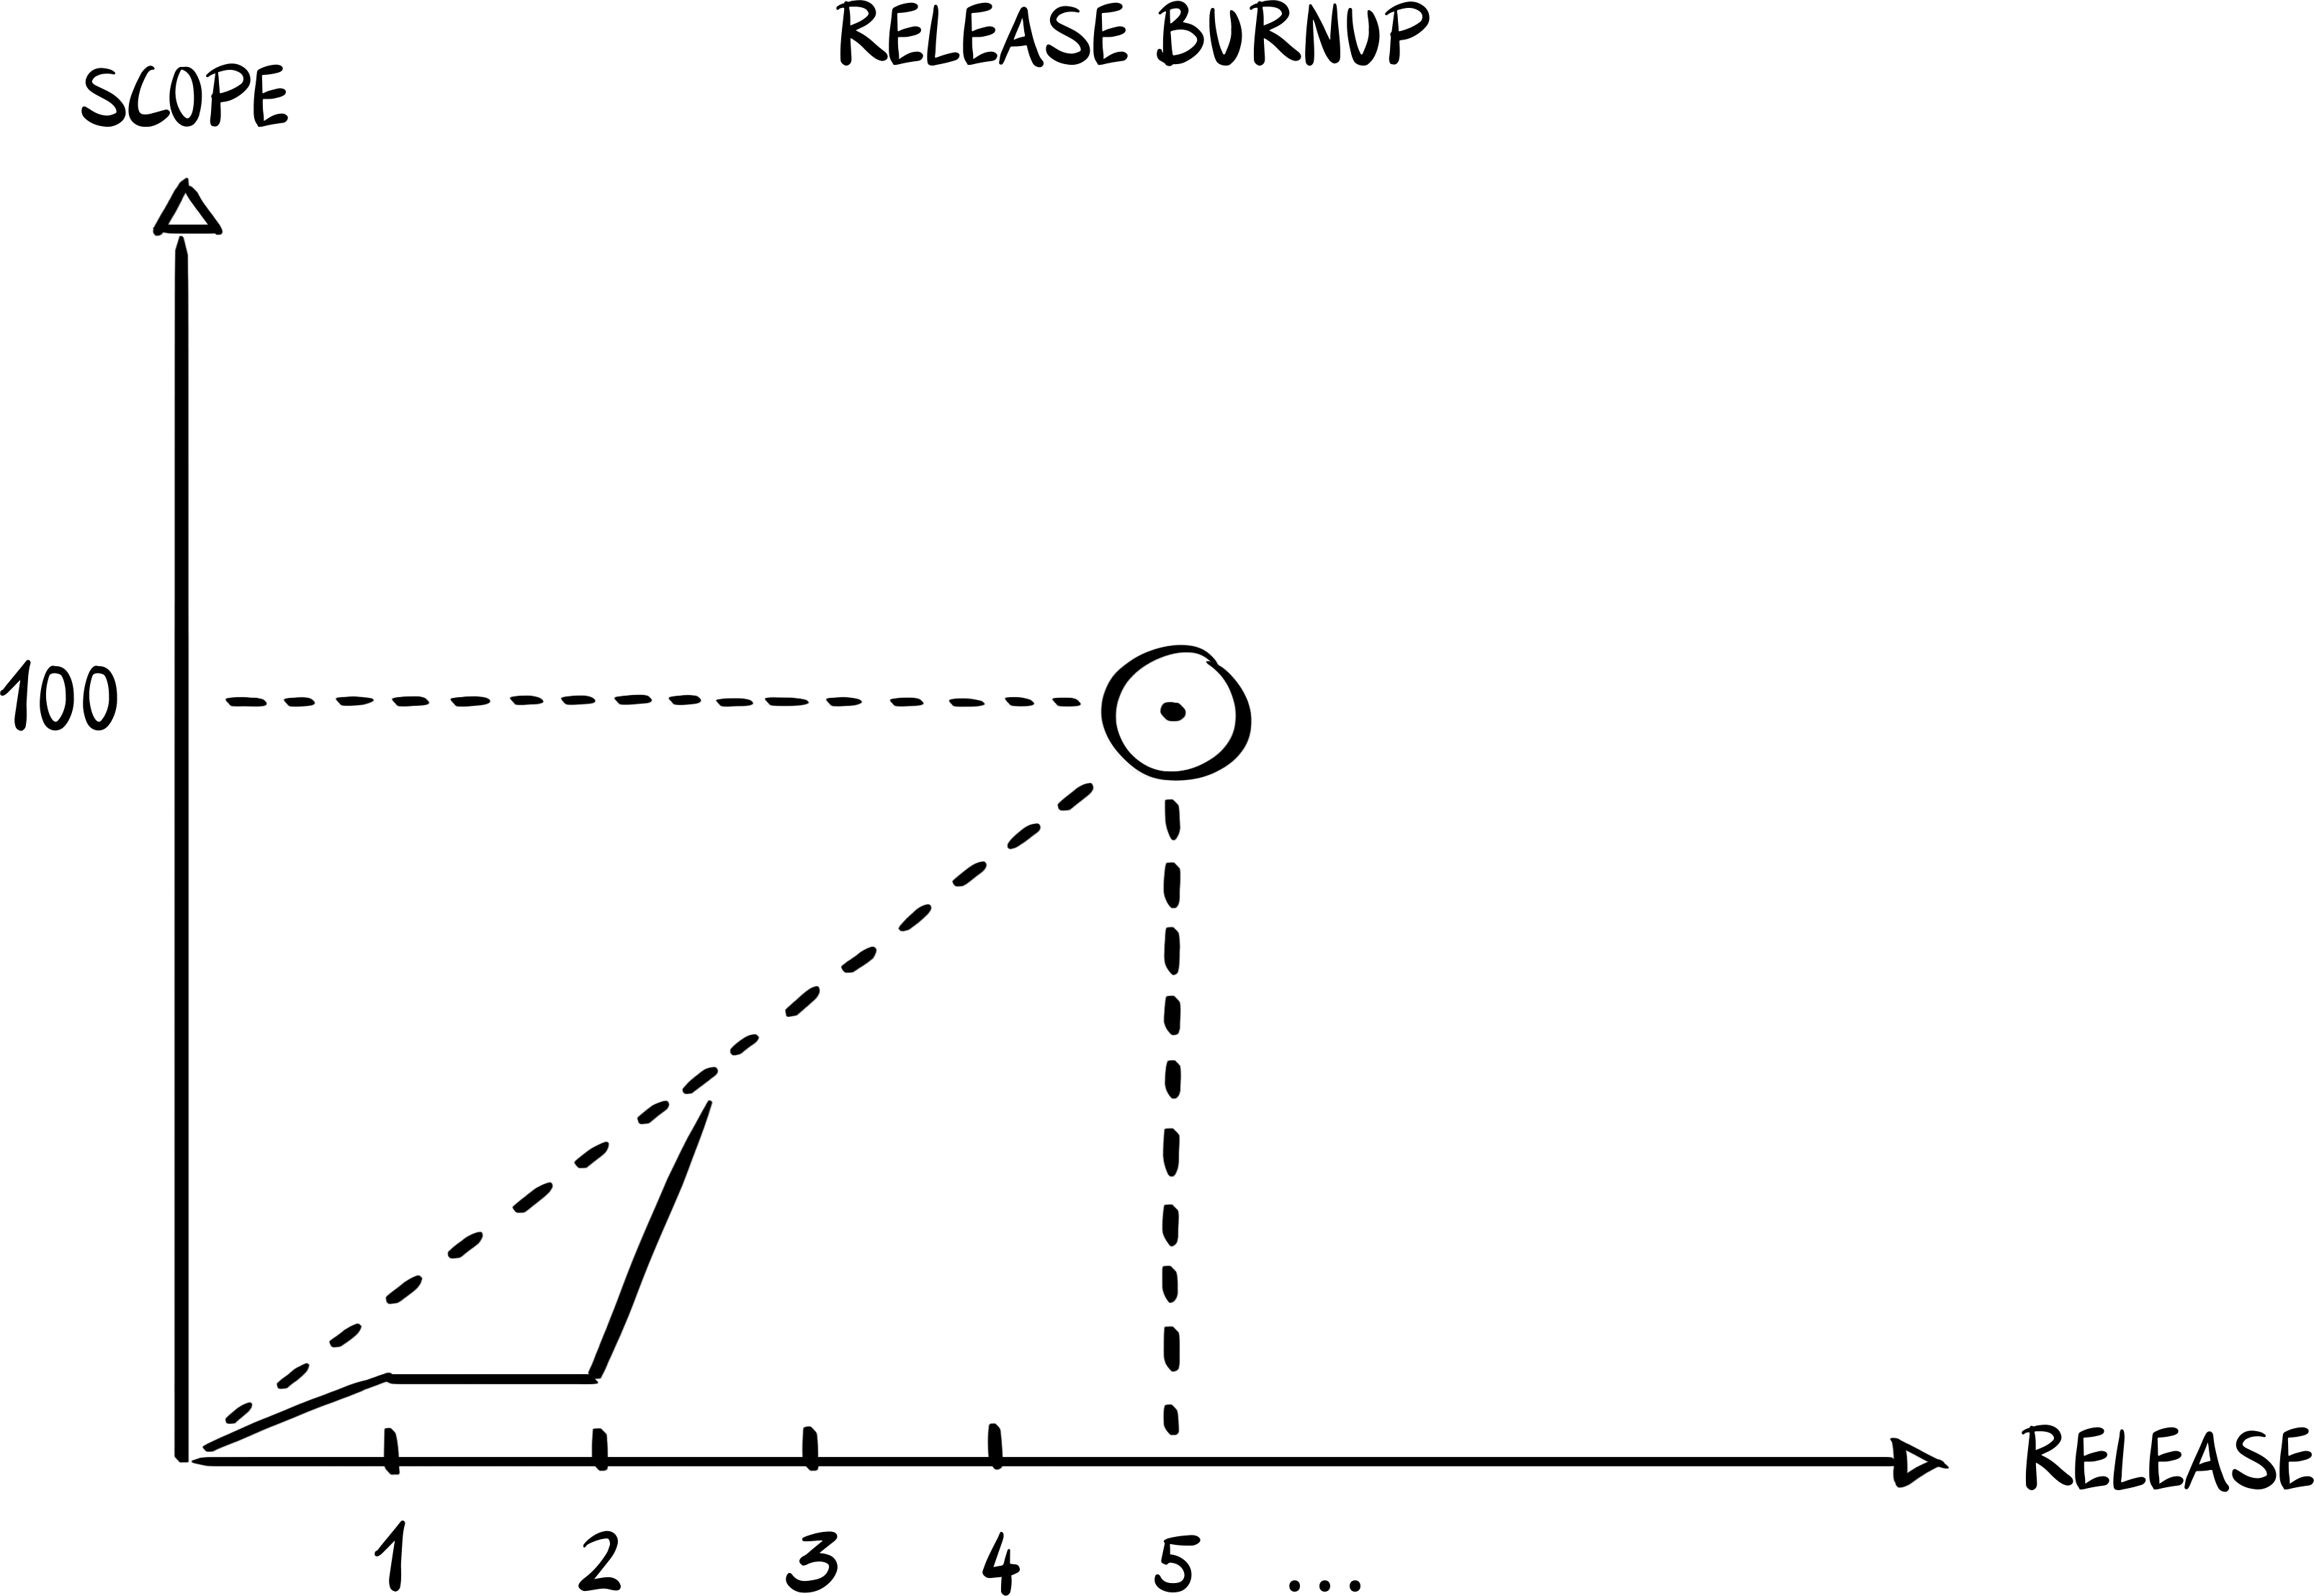
Use of the Burnup Chart:
A burnup chart is used by Agile and Scrum teams to check progress and manage scope or feature creep. This chart allows Agile teams to track when work has been added or removed from the project, and helps the team to determine a realistic completion date for the project.
Benefits of the Burnup Chart:
- The Burnup Chart helps to easily recognize and solve problems in your project.
- The Burnup Chart helps to estimate when the project will be complete.
- The Burnup Chart improves communication and transparency.